Why DevOps
Good infrastructure is invisible.
Because I'd rather build the system than approve it.
Twelve years on the infrastructure side — from pulling cable to running an IT department. The management years gave me something engineers rarely get: I've seen what infrastructure costs, who it burns out, and what it actually returns.
The engineering never paused: Terraform, Kubernetes, GitLab CI, Grafana — things I build with my own hands.
What a release looks like
One release end to end: plan, canary rollout, metric check, notification.
Automation shortens time from idea to impact.
- CI/CD pipelines make releases fast and safe.
- Infrastructure as code: environments come up from the repo with one command.
- A mistake in a manual step surfaces in production, not in the pipeline.
Projects
Pipelines, clusters, bots — from demo rigs to production.
- DEMOprj_logbot
LogBot
Telegram bot that pulls logs from Loki and explains them with gpt-4o-mini — incident triage without opening Grafana.
- Python
- Loki
- Prometheus
- OpenAI API
- DEMOprj_satellite_telemetry
Satellite Telemetry System
End-to-end DevOps showcase: Terraform on Yandex Cloud, K3s cluster via Ansible roles, tag-driven CI/CD on GitHub Actions, Helm-packaged microservices, observability on VictoriaMetrics + Grafana + Loki + Alertmanager.
- Terraform
- Ansible
- Kubernetes
- Helm
- GitHub Actions
- Grafana
- PRODprj_vpn_platform
VPN platform
Multi-stage Docker + compose overlays for dev/test/prod, custom SSH-driven health pipeline for VPN nodes (async, 120s interval, metrics fed to load balancer), systemd-timer DB backups every 6h, CI secret scanner on pre-merge.
- Docker Compose
- systemd
- Nginx
- Alembic
- DEMOprj_yc_microservices
Yandex.Cloud Microservices Demo
Microservices demo deployed to a Docker Swarm cluster on Yandex Cloud, provisioned with Terraform and Docker Compose.
- Docker
- Terraform
- HCL
Career
Roles, qualifications, certificates — and what overlapped with what.
- IT Director qualification
- DevOps Engineer certificate· SkillFactory
- Diploma: DevOps Engineer
DevOps Pipeline
Every stage is a gate: fail it and nothing moves on.
- CodePull request, review, lint on pre-commit.
- BuildBuild artifact, Docker image, layer cache.
- TestUnit, integration, e2e — parallel in CI.
- DeployCanary rollout via GitOps to Kubernetes.
- MonitorMetrics, logs, alerts — Prometheus + Loki.
DevOps Toolbox
The stack that automation and observability run on.
CI/CD
From PR to production with no manual steps. Pipelines on GitLab CI and GitHub Actions, canary deploys, rollback as a button.
Observability
Metrics, logs, and traces that answer questions before they're asked. Prometheus, Grafana, Loki, SLO-driven alerts instead of noisy thresholds.
IaC
Infrastructure as code — repeatable, reviewable, recoverable. Terraform for cloud, Ansible for configuration, GitOps for sync.
Containers
Runtime that's identical in dev / staging / prod. Docker for packaging, Kubernetes for running, Helm for release versioning.
UI & Design Work
Interfaces to infrastructure: dashboards, admin panels, landing pages.
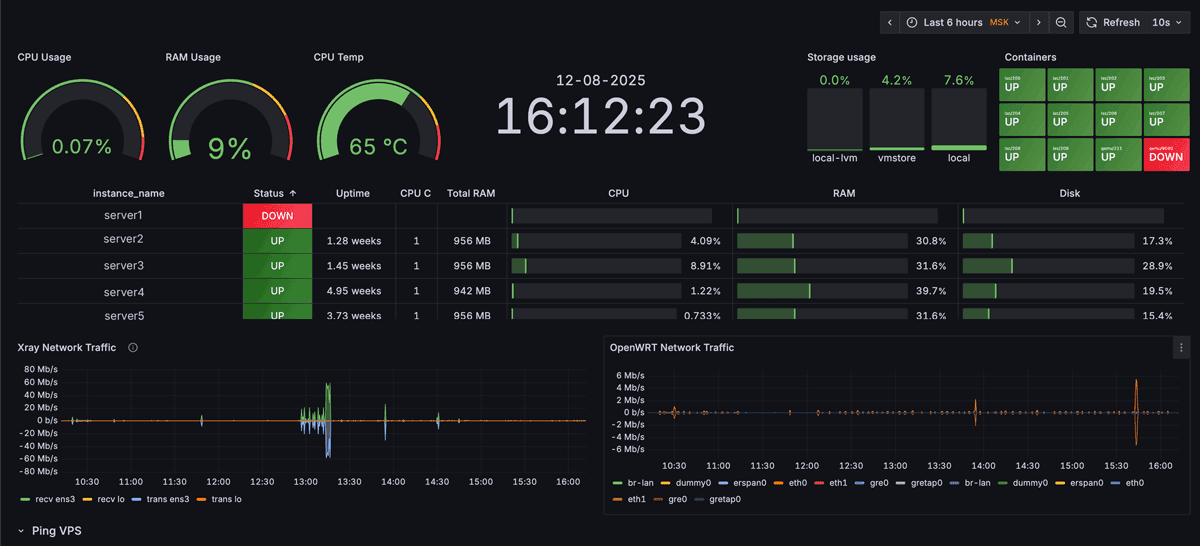
Grafana Dashboard for Portable Display
Proxmox host dashboard on a portable display driven by a Raspberry Pi 4 — the key metrics always in view.
GrafanaJSON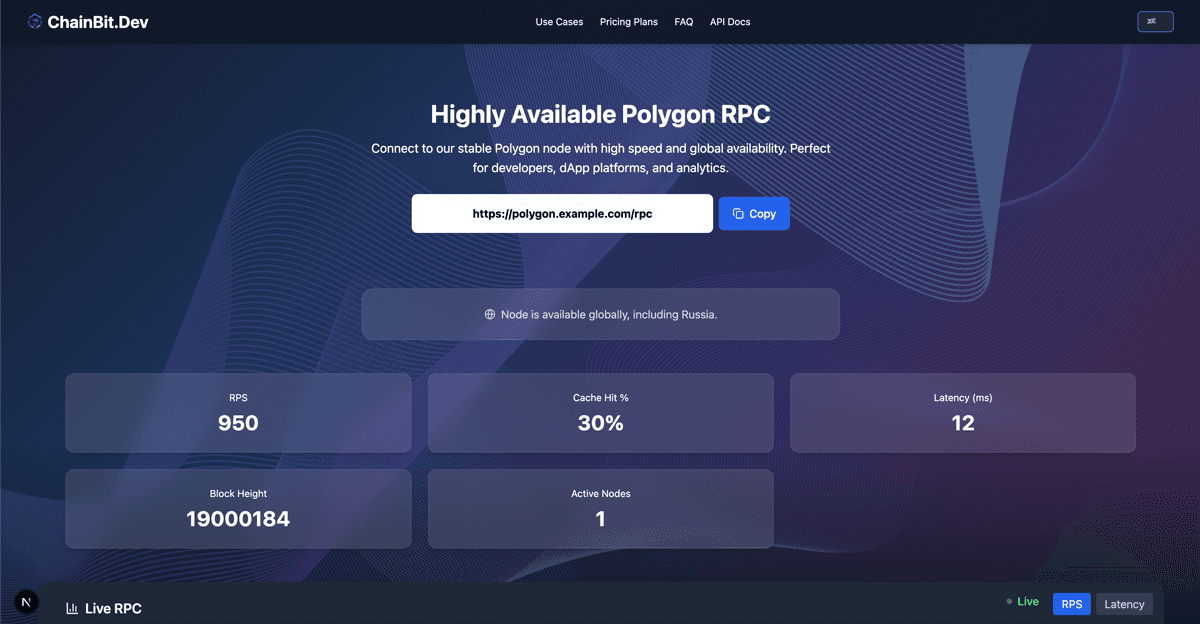
Landing for Polygon Node
Single-page landing for a Polygon validator node with live metrics.
Next.jsTailwind CSS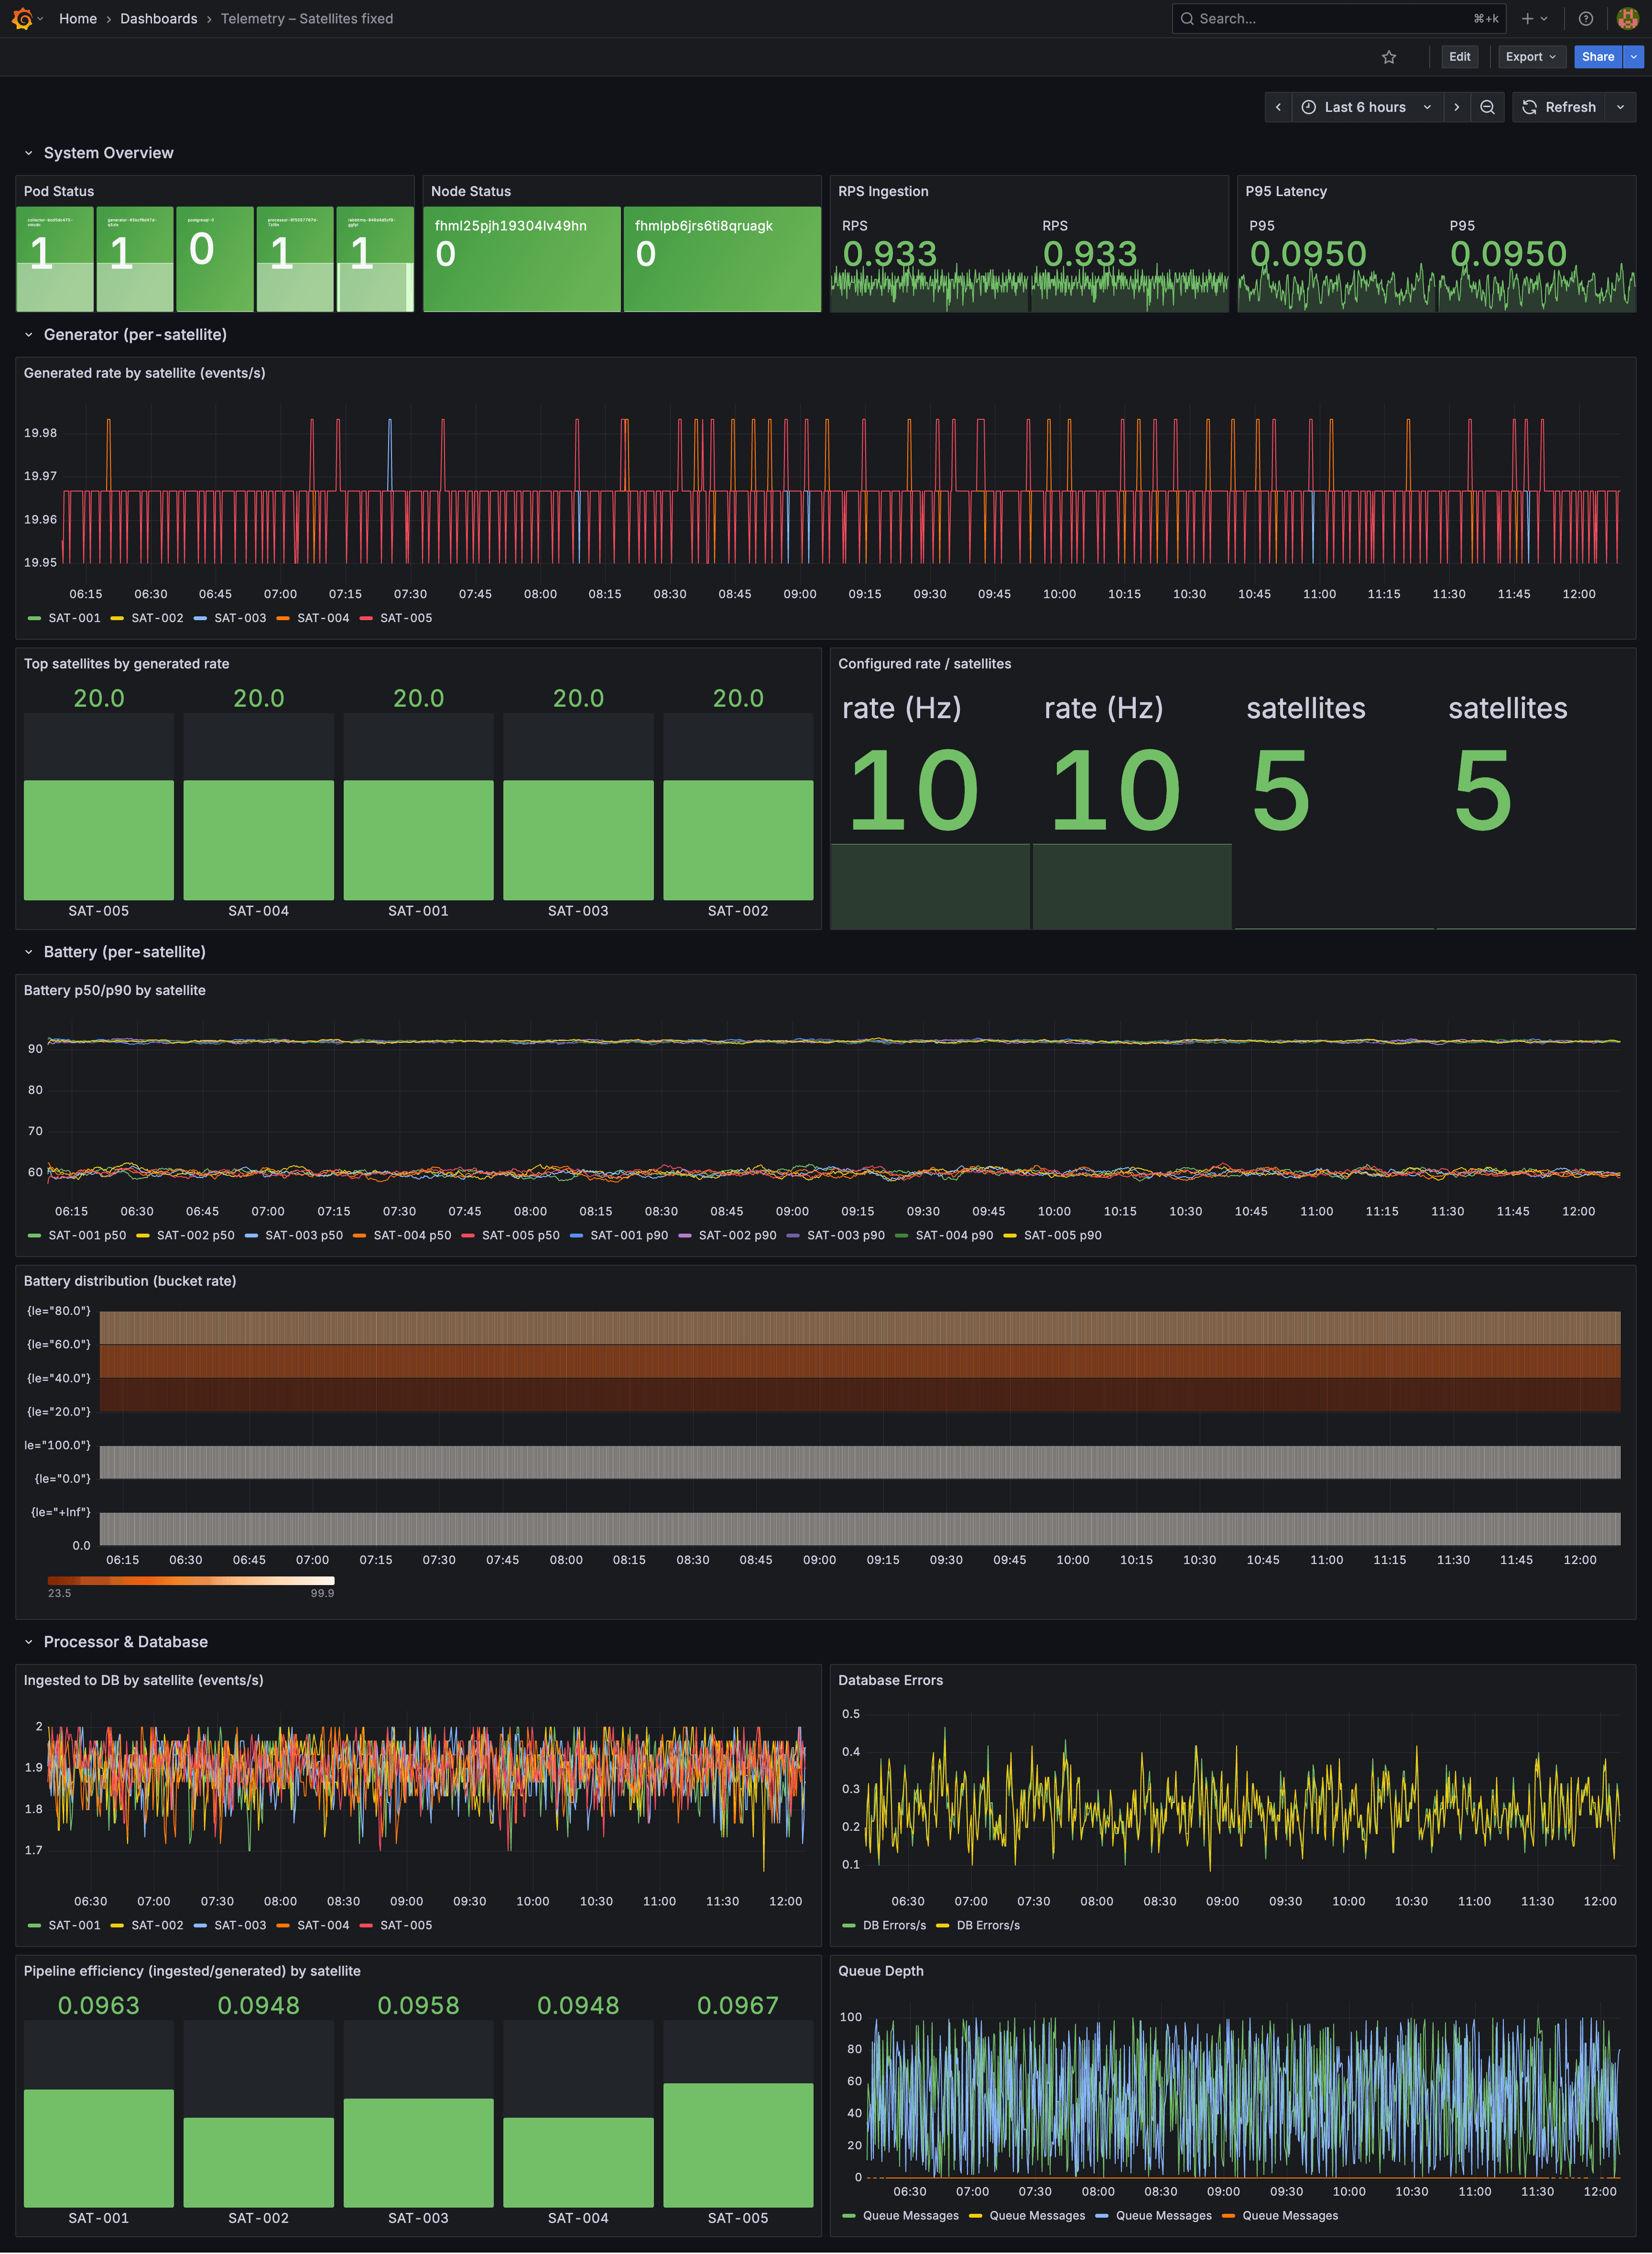
Satellite Telemetry Dashboard
Production-grade Grafana surface for a satellite-telemetry system: System Overview (Pod / Node, RPS, P99 latency), per-satellite generator metrics, battery distribution, ingested rate, database errors, pipeline efficiency, queue depth.
GrafanaVictoriaMetricsLoki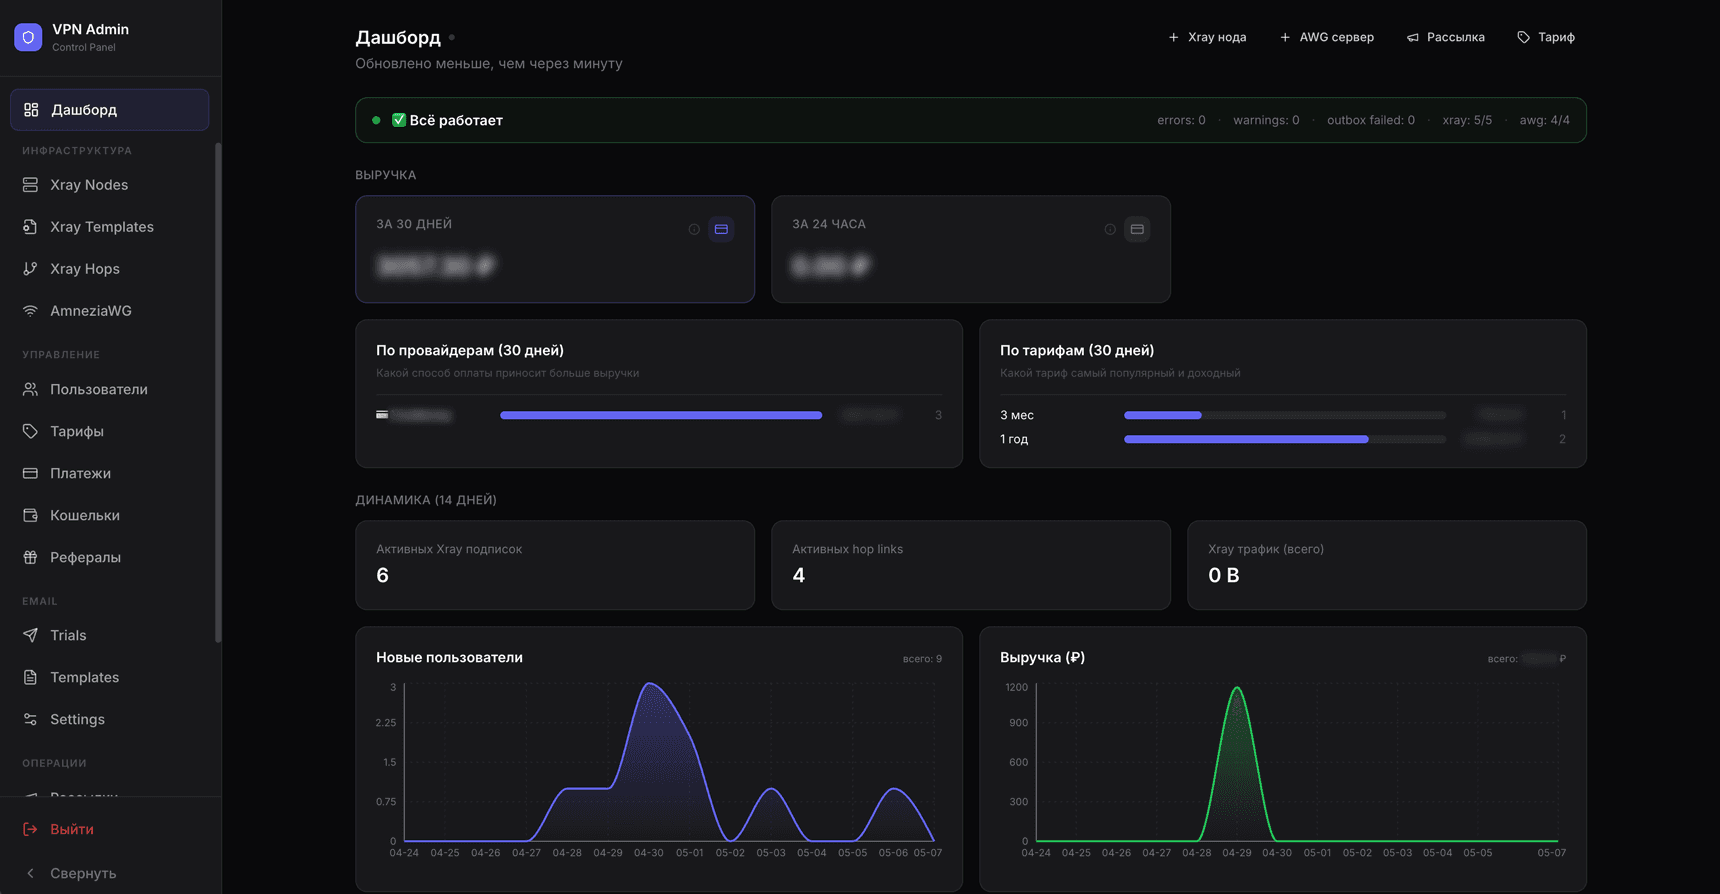
VPN Admin Dashboard
Admin home for a VPN subscription service: infrastructure status, 30-day / 24-hour revenue, provider and tariff breakdowns, new-users and subscription-dynamics charts over 14 days.
ReactViteTailwind